
A severe wildfire outbreak has occurred in the Los Angeles area of the United States
In the past month, California, United States, has experienced scarce precipitation with a total accumulation of less than 5 millimeters (Figure 1), resulting in extremely dry atmospheric conditions. From January 6th to 8th, a strong, warm high-pressure ridge extending north-south over the west part of North America tilted eastward and intensified significantly. At lower atmospheric levels, the dry, cold northeast airflow on the southeastern side of the warm high-pressure ridge moved southward into southern California, intruding into the warm air mass. The intense temperature contrast triggered the formation of cyclones. The northeast airflow on the southeastern side of the high-pressure ridge was drawn into the cyclone, creating the strong "Santa Ana winds" that blew from the inland desert areas of southern California to the Pacific coast (Figure 2). Enhanced by the funnelling effect of complex topography in mountainous and hilly regions, these winds could reach gusts of up to 160 kilometers per hour. Consequently, the fires spread rapidly and continuously under the influence of the high-speed, low-humidity Santa Ana winds, and have completely spun out of control.
Forecast from January 11th to 13th, there will be scarce precipitation in California, United States (Figure 3), with the maximum temperature ranging from 20 to 22 degrees Celsius, and wind speeds remaining above level 6, with maximum gusts exceeding 29 m/s (Figure 4), which will pose significant difficulties for local firefighting efforts.
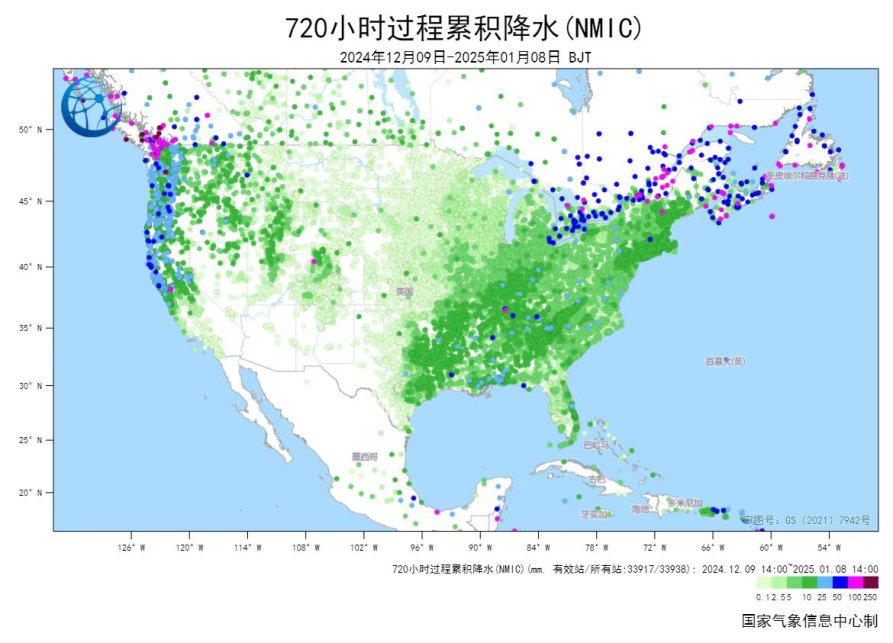
Figure 1: Cumulative precipitation (unit: mm) in the United States from December 9, 2024, to January 8, 2025 (Beijing Time)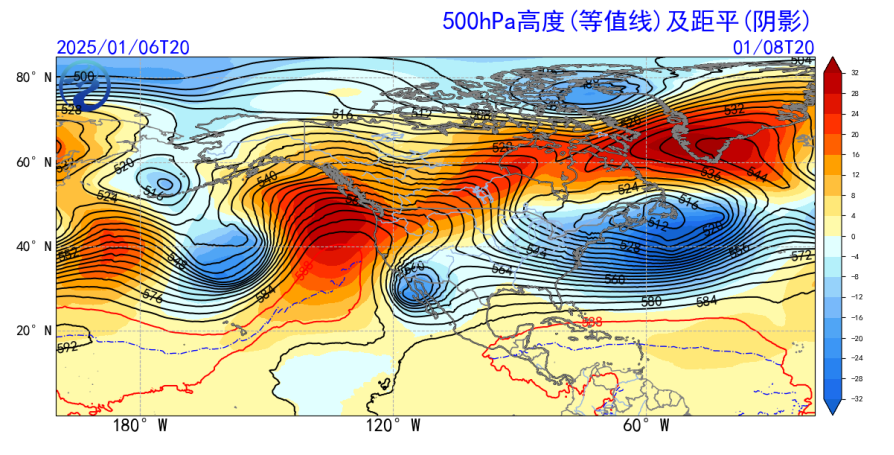
Figure 2: Potential height (contours) and anomalies (shaded) at 500 hPa over North America from January 6 to 8, 2025 (Beijing Time)
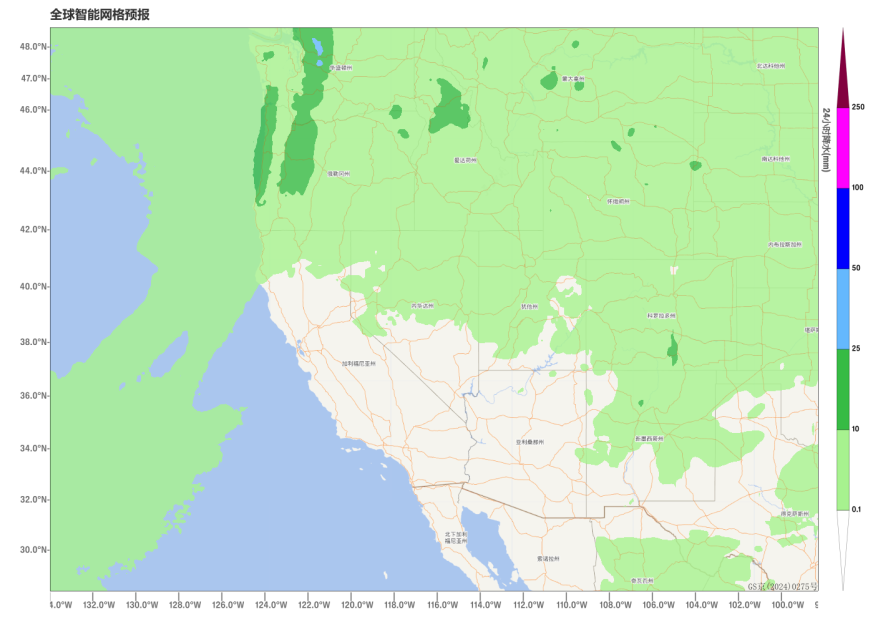
Figure 3. Accumulated precipitation (unit: mm) in the southwestern United States from January 11 to 13, 2025 (Beijing Time)
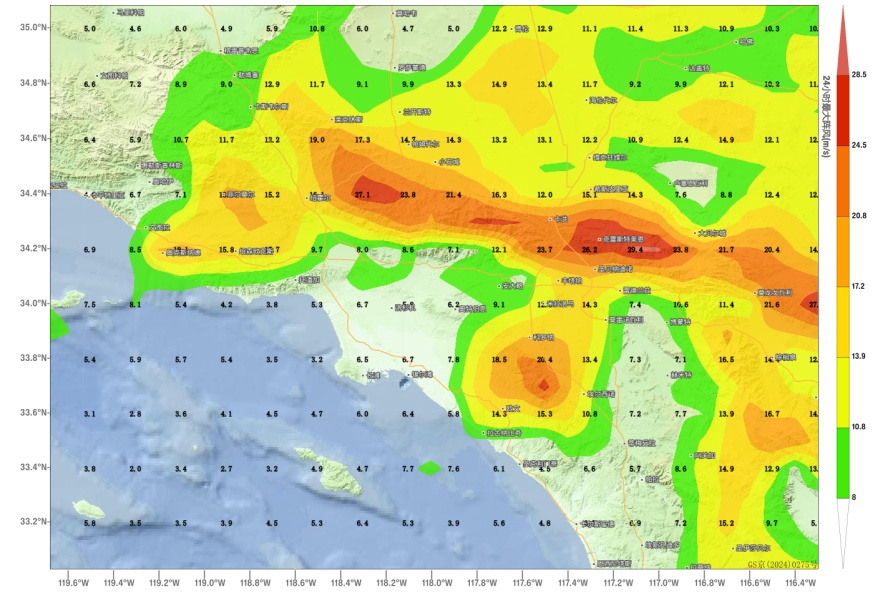
Figure 4. Maximum gust wind speed (unit: m/s) in California, United States from January 11 to 13, 2025 (Beijing Time)
![]()
Author: Huo Da Reviewer: Bao Yuanyuan
English reviewer:Wang Yi Issue approver:Dai Kan