全球灾害性天气监测月报 —2025年3月— | ||
世界气象中心(北京) |
| 2025年4月10日 |


Global Disastrous Weather Report in March 2025
Abstract: In March 2025, above-average temperatures were recorded in Europe, western West Siberia, and southern North America, with above-average rainfall observed in southern Europe, northern and eastern Australia, and in Bolivia and Argentina of South America. Four tropical cyclones formed around the globe; Spain and Bolivia, as well as other regions, experienced torrential rains and flooding, Mongolia was hit by severe sandstorm conditions, and severe storm conditions impacted various parts of the United States.
1 Overview of global weather
1.1 Temperature
In March, average temperatures across Europe, western Siberia, southern North America, including the Alaska region, northwestern Africa, and in western and southern Australia, as well as southern Brazil, were 1 to 3 degrees Celsius above average for the same period in previous years, with some areas in southwestern Eastern Europe seeing temperature increases exceeding 4 degrees Celsius. Conversely, parts of the Russian Far East and Canada saw temperatures 1 to 2 degrees Celsius below their usual averages.
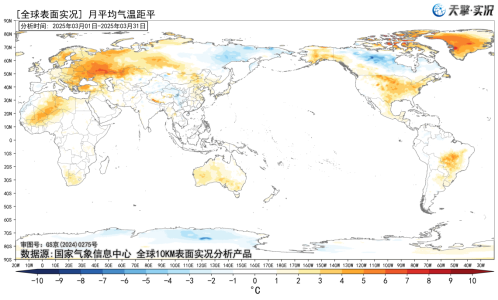
Fig.1 The global average temperature anomaly recorded for March 2025 (Unit: ℃)
1.2 Precipitation
In March, total rainfall in Southern Europe, southeastern China, the Japanese islands, the northern central United States, southern Labrador Peninsula of Canada, southern East Africa, northern and eastern Australia, Bolivia and Argentina in South America, and other areas, ranged from 50 to 150 millimeters of rain, with local amounts exceeding 200 millimeters. These areas saw 30% to 70% more rainfall than average levels for that period, and in some locations, amounts reached up to double. However, in southern Central Africa, New Guinea Island, and northern South America, total rainfall was between 100 and 250 millimeters, with local amounts surpassing 300 millimeters; yet, compared to average levels for that period, these regions experienced 30% to 70% less rainfall.
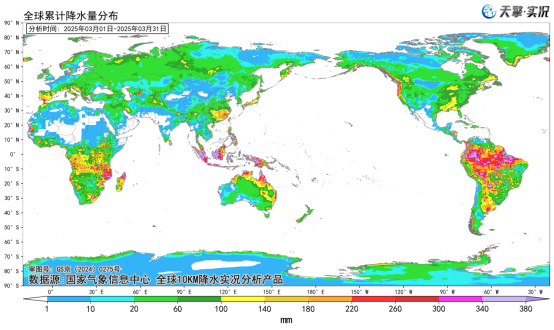
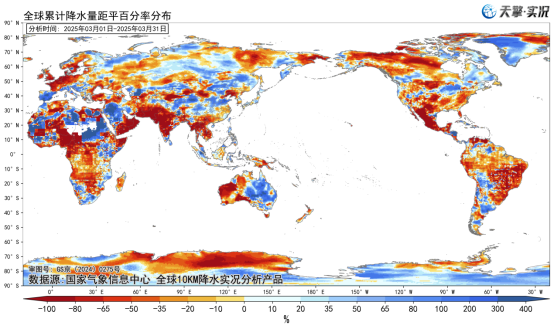
Fig.2 Cumulative global precipitation for March 2025 (above, unit: mm) and the percentage of its anomaly (below, unit: %)
![]()
制作:霍达 饶晓琴 华珊 蔡雪薇 宋佳凝 姚燕 周奕珂 签发:牛若芸
 京公网安备 11040102700102号